
Platforms
Sankey flow analysis
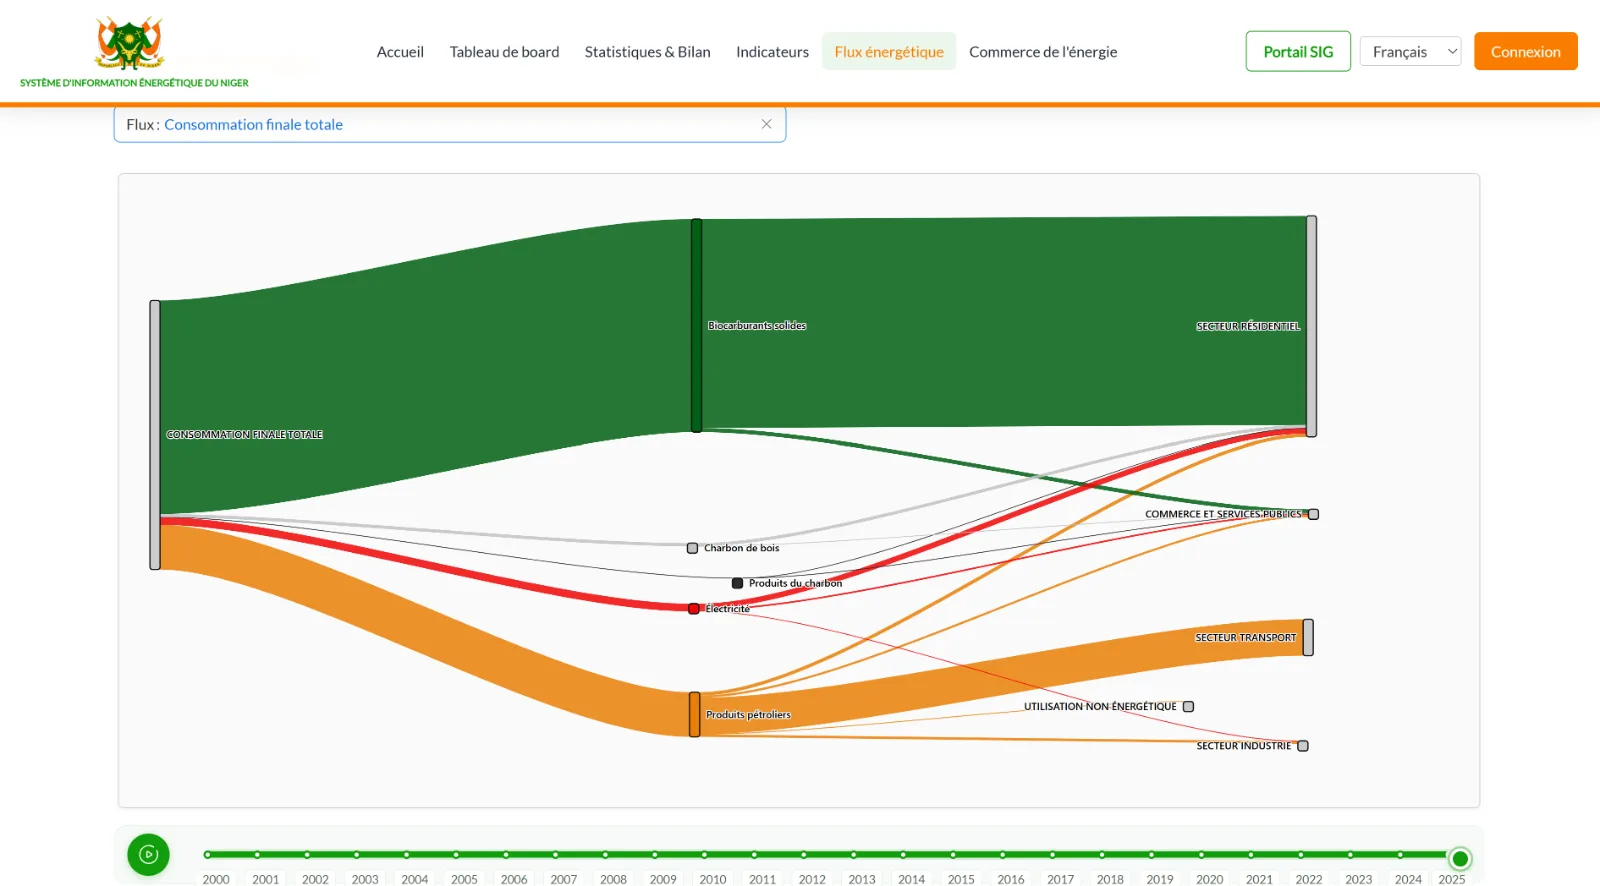
Sankey diagrams turn an energy balance into a single picture: where energy comes from, how it is transformed and where it is used.
What we deliver
- Sankey diagrams generated automatically from the energy balance
- Views by year, country, product and sector
- Interactive charts for websites and printable versions for reports
- Integration into SIG-SE and existing energy information systems
Contact
Let’s talk about your project
Tell us about your needs and we will get back to you quickly.
Contact us