
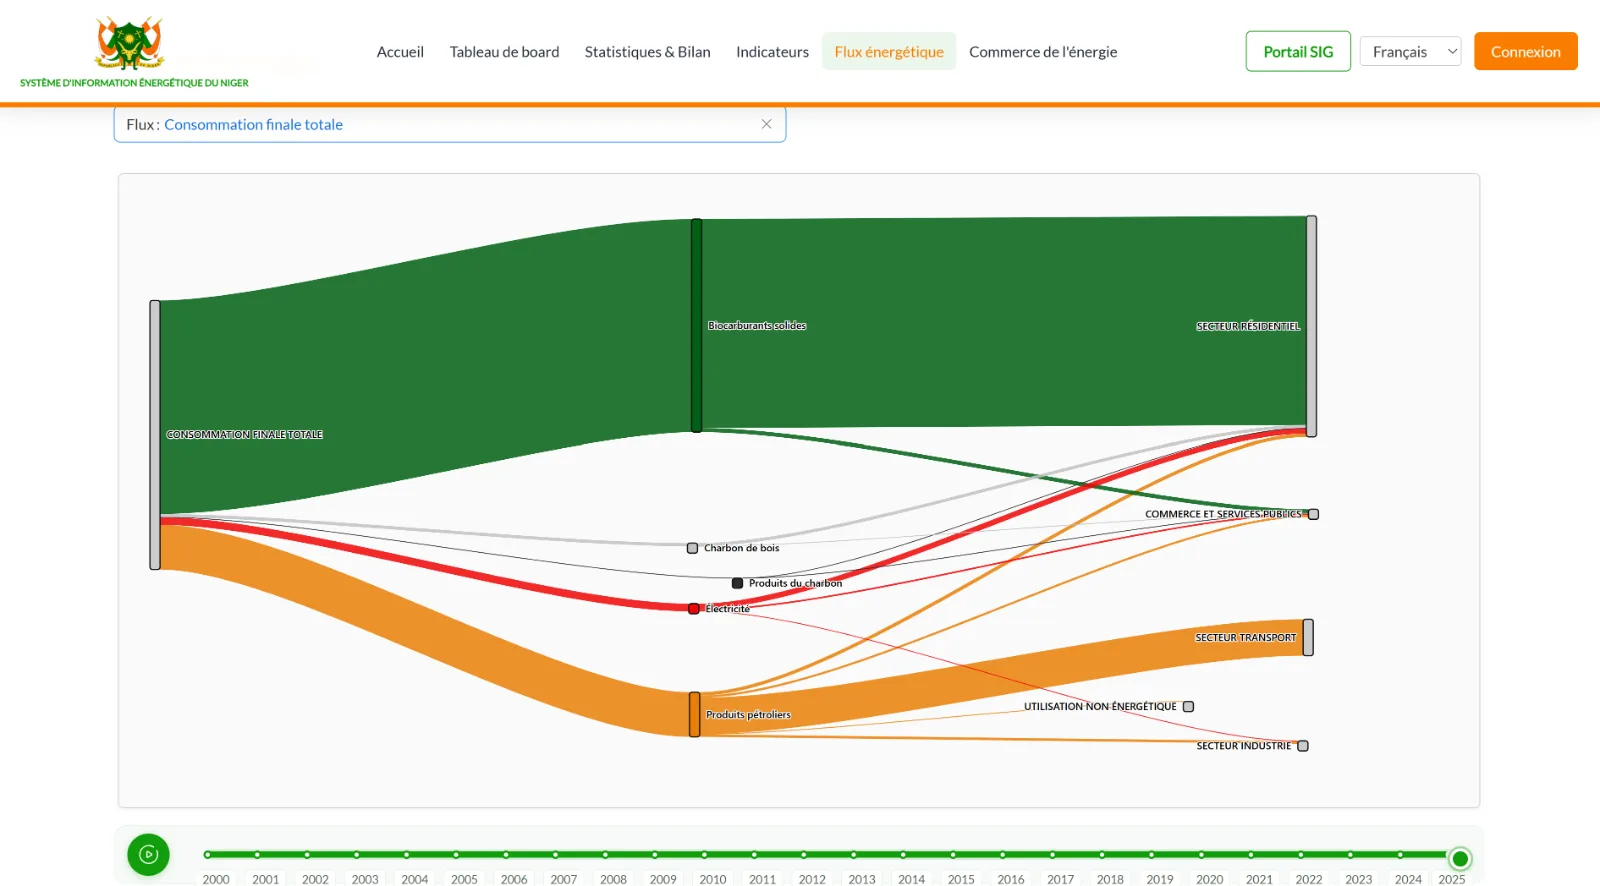
The Niger Energy Information System, which we are building for the Ministry of Energy under the World Bank-funded HASKE project, now makes it possible to follow the country’s energy-related CO2 emissions over almost a quarter of a century, sector by sector. The picture it gives is very different from the one of the early 2000s.
2000: a simple carbon profile
In 2000, two sectors dominated the country’s emissions: road transport, with 55%, and electricity production and distribution, with 36%.
Since 2011-2012: refining takes the lead
From 2011-2012, a third sector emerged with the start of domestic crude oil refining. In 2017, oil refining alone accounted for 64% of national CO2 emissions. In 2024, it remained the leading source with 48%, ahead of transport (27%) and electricity production (19%).
Why it matters
This shift tells the story of a structural transformation of the energy economy. It would remain invisible without a tracking tool that is reliable and broken down by sector. For decision makers, it changes the priorities of climate policy; for development partners, it changes where support can have the most impact; for researchers, it provides consistent series over a long period.
How the figures are produced
Emissions are calculated directly from the national energy statistics collected in the platform, using IPCC emission factors. Energy data and climate reporting therefore rely on the same source and remain consistent with each other.
This is exactly what a good energy information system does: turn raw data into a strategic reading for decision makers, funders and researchers. Learn more about our GHG work or contact us.